Looking back at Equity Factors in Q3


Pierre Debru, Head of Quantitative Research & Multi Asset Solutions, WisdomTree Europe
After five straight quarters of positive performance, the rally in developed equities started to wane in Q3 this year. The rally had been driven mostly by an unprecedented level of monetary accommodation and vaccine optimism, coupled with pent-up demand and finally, fiscal stimuli. However, starting in September, worries about inflation remaining higher for longer, stagflation[1] and potential rate hikes in the US and UK have dampened equity market sentiment. The balance between those different themes varies between regions leading to marked geographical differences. Cyclical factors continued to do well in Europe while more defensive ones performed better in the US, where the business cycle appears more advanced.
In this instalment of the WisdomTree Quarterly Equity Factor Review[2], we aim to shed some light on how equity factors behaved over the last three months and how this may have impacted investors’ portfolios.
- In Q3, Momentum was the only factor that managed to outperform across developed markets, closely followed by Quality.
- In Europe, cyclical factors continued to do well, while in the US, they suffered the most.
- However, September saw Value lead the way across regions. This second factor rotation of the year could find its root in the continued elevated inflation prints creating tailwinds for value stocks and financials in particular.
Looking forward to Q4, uncertainty is rising, and investors have started to reassess the risk linked to lower growth, higher inflation, central bank policy tapering and potential interest rate hikes. While research has shown that value does well in periods of steady rate increases, it appears that it is not the case around tapering events. Tapering usually happens before any rate hikes occur, and in the last 15 years, momentum and Quality performed better around such events.
Performance in focus: Cyclical in Europe, Defensive in the US
In the third quarter of 2021, the equity rally stopped in its tracks on stagflation and rate hike worries. The MSCI World lost -0.01% over the quarter, after five straight quarters of positive performance (since March 2020’s nadir). Europe led the way with a 0.7% increase.
In Q3 2021, we observed large geographical disparities in factor performance as well as another factor rotation in September:
- Momentum was the only factor to outperform in developed markets. It beat MSCI World by 1% and MSCI Europe by almost 1.4%.
- In Europe, cyclical factors continued to do well, with Value and Size outperforming as a sign that the business cycle may be less advanced in the region. Both factors also benefitted from the strong earnings season in the region.
- On the contrary, in the US, cyclical factors suffered the most.
- Emerging Markets lost -8% over the quarter, dragged down by China and the Evergrande story. Min Volatility and Size posted the strongest gains.
Figure 1: Equity factor outperformance in Q3 2021 across regions

Source: WisdomTree, Bloomberg. 30th June 2021 to 30th September. Historical performance is not an indication of future performance and any investments may go down in value.
However, September saw Value lead the way. It outperformed by 1.1% in the US, 1.2% in Europe, and 2.7% in developed markets. This marked a second factor rotation in 2021. After Value and Size dominated the first part of the year, Quality took over in spring and summer. Now Value is back again, pushed by continued elevated inflation prints and approaching rate hikes, creating tailwinds for value stocks and financials in particular.
Looking back at the first nine months of the year, the multiple factor rotations created a tough environment for factor investing in developed markets. Only Quality, Size and Value created some outperformance. In emerging markets, however, factors have been performing very strongly. Only momentum underperformed, with Size delivering 18% of outperformance during 2021 so far.
Figure 2: Year to Date outperformance of equity factors
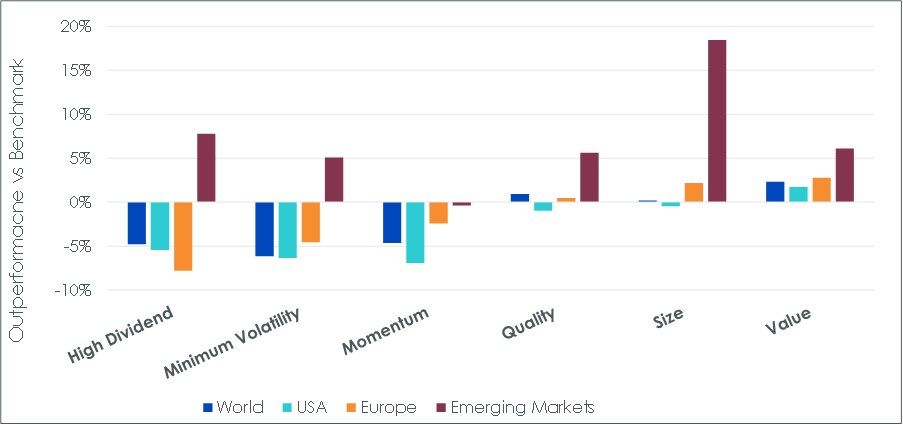
Source: WisdomTree, Bloomberg. 31st December 2020 to 30th September 2021. Historical performance is not an indication of future performance and any investments may go down in Value.
Factors and Taper Tantrums
The Federal Reserve (Fed) and other Central Banks worldwide reacted very quickly to the pandemic with an unprecedented level of monetary stimulus. Recently, central bank officials in the US have signalled their willingness to start “tapering,” i.e. slowly removing that stimulus.
Research has shown that more cyclical factors like Value and Size are more prone to react positively to continuous rate hikes than defensive factors like Min Volatility. However, tapering is not an increase in rates. In fact, Fed Chair Jerome Powell made this distinction in September, saying, “going to be well away from satisfying the liftoff test when we begin the taper.”
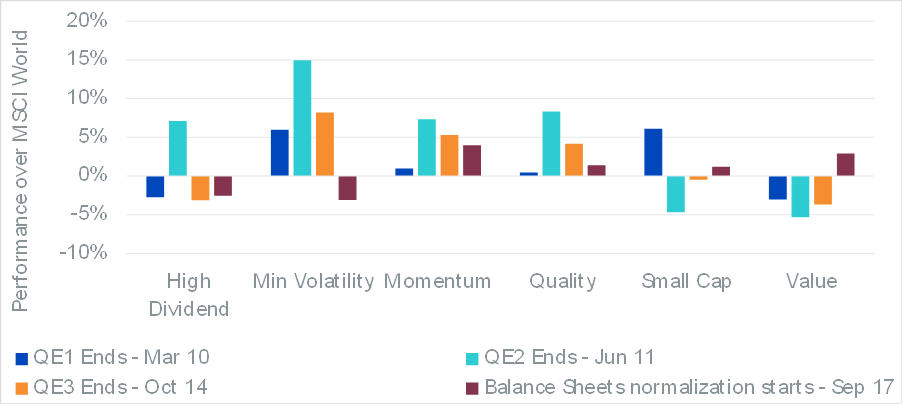
In Figure 3, we look at the performance of equity factors around past periods of tapering. We observe that Quality and Momentum are the only factors to have delivered outperformance in the six months surrounding tapering events (i.e. the time where tapering starts not when it is announced). Value delivered the worst performance overall, underperforming in 3 of the 4 instances.
Figure 3: Outperformance of equity factors from 3 months before to 3 months after tapering events
Source: WisdomTree, Bloomberg. 31st December 2009 to 31st December 2017. Historical performance is not an indication of future performance and any investments may go down in Value.
Valuations continue to come down on the back of improved earnings
In Q3 2021, valuations have decreased across the majority of factors globally. Value is starting to exhibit single-digit price to earnings ratios. Size continues to normalize after trading at double-digit premiums earlier this year.
Figure 4: Historical Evolution of Price to Earnings ratios of equity factors

Source: WisdomTree, Bloomberg. As of 30th September 2021. Historical performance is not an indication of future performance and any investments may go down in Value.
Uncertainty is rising, equity markets have paused their climb to new highs, and tapering is upon us. Diversification in portfolios is going to be key from now on to guard against increased volatility and complacency. In that context, investors could benefit from repositioning for scenarios when more defensive or more-rounded factors could do well, keeping in mind that Momentum and Quality have historically performed better around tapering events.
World is proxied by MSCI World net TR Index. US is proxied by MSCI USA net TR Index. Europe is proxied by MSCI Europe net TR Index. Emerging Markets is proxied by MSCI Emerging Markets net TR Index. Minimum volatility is proxied by the relevant MSCI Min Volatility net total return index. Quality is proxied by the relevant MSCI Quality net total return index.
Momentum is proxied by the relevant MSCI Momentum net total return index. High Dividend is proxied by the relevant MSCI High Dividend net total return index. Size is proxied by the relevant MSCI Small Cap net total return index. Value is proxied by the relevant MSCI Enhanced Value net total return index.
This material is prepared by WisdomTree and its affiliates and is not intended to be relied upon as a forecast, research or investment advice, and is not a recommendation, offer or solicitation to buy or sell any securities or to adopt any investment strategy. The opinions expressed are as of the date of production and may change as subsequent conditions vary. The information and opinions contained in this material are derived from proprietary and non-proprietary sources. As such, no warranty of accuracy or reliability is given and no responsibility arising in any other way for errors and omissions (including responsibility to any person by reason of negligence) is accepted by WisdomTree, nor any affiliate, nor any of their officers, employees or agents. Reliance upon information in this material is at the sole discretion of the reader. Past performance is not a reliable indicator of future performance.
[1] Persistent high inflation combined with high unemployment and stagnant demand in a country’s economy.
[2] Definitions of each factor are available below
Retrouvez l’ensemble de nos articles Business ici


