Broad Commodities, not just another cyclical asset


Pierre Debru, Head of Quantitative Research & Multi Asset Solutions, WisdomTree Europe
Since the beginning of the covid-19 pandemic, broad commodities have benefitted from a new lease of life. The Bloomberg commodity index is up almost 60%[1] from its nadir, and investments, tactical or strategic in nature, are flowing once again to the asset class. However, unrelated to their recent performance, broad commodities can be an additive to a multi-asset portfolio. In our previous blog, we focused on commodities’ diversification superpowers. In this blog, we want to look at the behaviour of commodities across the business cycle.
Analyses show that broad commodities, while cyclical, complement other cyclical assets like equities very well across the business cycle:
- Broad commodities tend to resist pretty well in the early phase of a recession, a period where equities suffer the most.
- They also tend to do well in the late part of an economic expansion when equities usually fail to find their second wind.
Commodities benefit from economic expansions
Intuitively, it feels like commodities should benefit from a positive economic environment. When the economy grows, it needs base materials to do so. Metals are required to build new homes, new factories, new infrastructure, new cars etc. More energy is consumed to move goods and people around. So overall, there is a logic to commodities behaving like a cyclical asset.
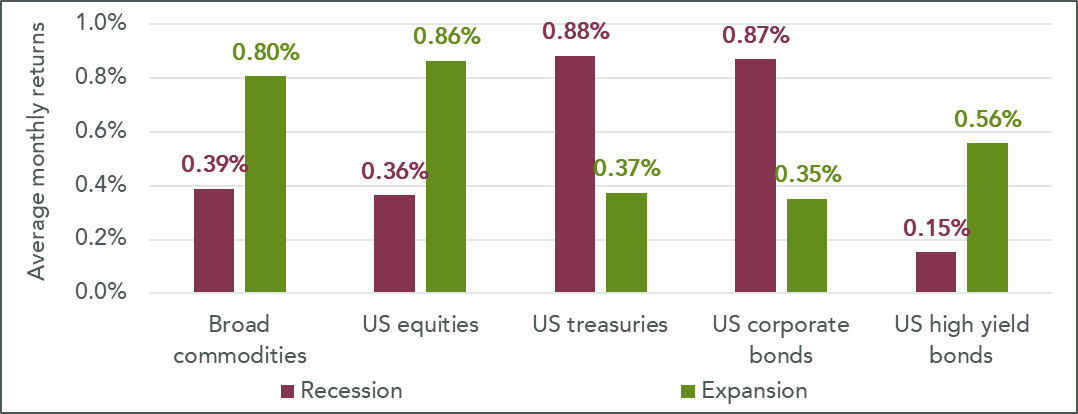
To fully assess the relationship of commodities with the business cycle, we turn to the National Bureau of Economic Research (NBER) Business Cycle Dating Committee, which maintains a chronology of US business cycles. The chronology identifies the dates of peaks and troughs that frame economic recessions and expansions. By comparing the performance of different assets in those recession and expansion periods, it is possible to assess their cyclicality. Figure 1 shows that equities have gained on average 0.86% per month in periods of expansion. This is the largest performance among the asset classes tested. They are followed by commodities (+0.80%), high yield bonds (+0.56%) and then corporate bonds (+0.35%). In periods of recession, high yield bonds (+0.15%) and equities (+0.36%) have performed less strongly. On the other side of the spectrum, US Treasuries and corporate bonds performed strongly (0.88% and 0.87%, respectively). Equities, commodities and high yield bonds are cyclical assets, with equities and commodities being the strongest.
Figure 1: Performance of various asset classes in periods of economic expansion and recession

Source: WisdomTree, Bloomberg, S&P. From January 1960 to August 2021. Calculations are based on monthly returns in USD. Broad commodities (Bloomberg commodity total return index) and US Equities (S&P 500 gross total return index) data started in Jan 1960. US treasuries (Bloomberg US treasury total return unhedged USD index) and US corporate bonds (Bloomberg US corporate total return unhedged USD index) data started in Jan 1973. US high yield bonds (Bloomberg US corporate high yield total return unhedged USD index) data started in July 1983. Historical performance is not an indication of future performance and any investments may go down in value.
Expansion and Recession phases are defined using the NBER website.
A surprisingly robust asset in early recessions
While logical, this cyclicality may seem difficult to reconcile with the low correlation between commodities and equities, as discussed in Broad Commodities, the portfolio’s super diversifier? Equities are also very cyclical, so how can two cyclical assets be so uncorrelated?
On average, in all the months since the 1960s where US equities have lost more than -5%, commodities have lost -0.65%[2]. In all the months where US equities gained more than 5%, commodities gained 1.13%1. So while commodities are cyclical, i.e. they tend to lose and gain broadly at the same time as equities, the amplitude of such gains is significantly more muted. This supports our decorrelation hypothesis. It appears that while commodities and equities tend to gain during the expansion phase of the business cycle, they may not gain at the same time, i.e. during the same part of the cycle.
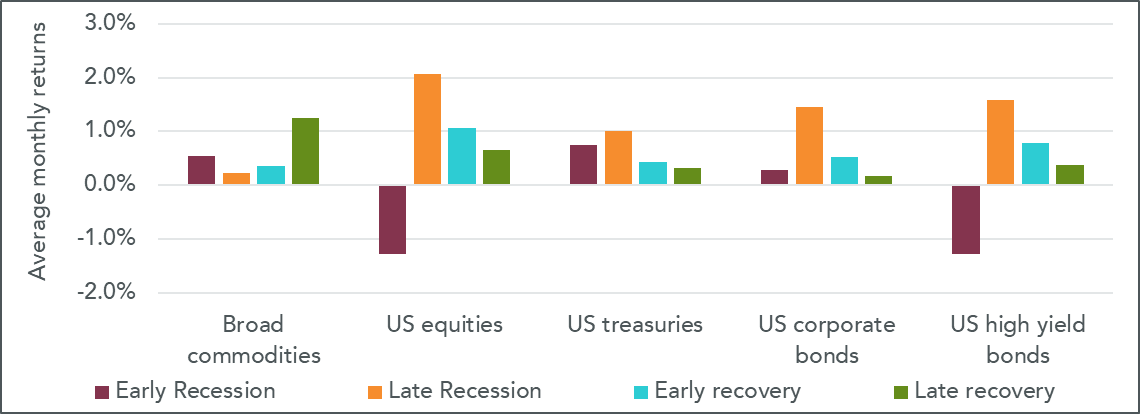
Figure 2 refines the analysis by splitting expansion and recession periods into two parts of equal duration. Through this lens, the results are pretty different. Equities and high yield bonds appear to behave very similarly:
- They suffer the most from the early recession part of the cycle but rebound the strongest in the later part of that recession.
- While they benefit from the expansion part of the cycle, they rise faster in the earlier part of that expansion.
On the contrary, commodities:
- Tend to hold up well in the early phase of a recession, posting on average a positive performance of 0.54% (vs -1.3% for equities).
- Suffer more in the later phase of a recession and trail both equities and high yield bonds.
- Perform better in the second half of the expansion period, contrary to equities that prefer the first half. Commodities are the strongest performers among all the asset classes in that late part of the expansion cycle.
So overall, while commodities are a cyclical asset, their behaviour is very decorrelated to equities or high yield bonds. They offer great diversification in early recession and late expansion phases when other cyclical assets (equities, high yield bonds) struggle.
Figure 2: Performance of equities and commodities across different parts of the business cycle

Source: WisdomTree, Bloomberg, S&P. From January 1960 to August 2021. Calculations are based on monthly returns in USD. Broad commodities (Bloomberg commodity total return index) and US Equities (S&P 500 gross total return index) data started in Jan 1960. US treasuries (Bloomberg US treasury total return unhedged USD index) and US corporate bonds (Bloomberg US corporate total return unhedged USD index) data started in Jan 1973. US high yield bonds (Bloomberg US corporate high yield total return unhedged USD index) data started in July 1983. Historical performance is not an indication of future performance and any investments may go down in value. Expansion and Recession phases are defined using the NBER website. To define early and late expansion/recession, the periods are split in half time-wise.
Late recoveries are commodities’ best friend
Commodities tend to perform the best in late recoveries, with an average performance of 1.25% in this phase. Judging by recent Composite Lead Indicator (CLI) prints[3], we are in the latter stages of the current economic expansion. The United States, Japan, Germany and the United Kingdom are nearing economic peak, and in the Euro area, there are signs of moderating growth[4]. If history is any guide, this could be an environment for commodity outperformance. We also take the view that there are some unique tailwinds behind certain segments of commodities that could propel them for years to come. For example, the energy transition to lower-carbon energy sources will likely be very metal positive (given their use in developing renewable and electrification infrastructure and battery technology). Also, a renewed interest in building infrastructure in the US and Europe could benefit commodity demand.
An excellent diversifier and a strong complement to equities across the business cycle are only two of the potential advantages broad commodities could bring to a portfolio. The next item to consider will be whether broad commodities could act as a powerful inflation hedge.
This material is prepared by WisdomTree and its affiliates and is not intended to be relied upon as a forecast, research or investment advice, and is not a recommendation, offer or solicitation to buy or sell any securities or to adopt any investment strategy. The opinions expressed are as of the date of production and may change as subsequent conditions vary. The information and opinions contained in this material are derived from proprietary and non-proprietary sources. As such, no warranty of accuracy or reliability is given and no responsibility arising in any other way for errors and omissions (including responsibility to any person by reason of negligence) is accepted by WisdomTree, nor any affiliate, nor any of their officers, employees or agents. Reliance upon information in this material is at the sole discretion of the reader. Past performance is not a reliable indicator of future performance.
[1] Bloomberg, WisdomTree, 27th April 2020 to 7 Dec 2021
[2] Source: WisdomTree, Bloomberg, S&P. From January 1960 to August 2021. Calculations are based on monthly returns in USD. Broad commodities (Bloomberg commodity total return index) and US Equities (S&P 500 gross total return index) data started in Jan 1960. Historical performance is not an indication of future performance and any investments may go down in value.
[3] The OECD system of Composite Leading Indicators (CLIs) is designed to provide early signals of turning points in business cycles: https://www.oecd.org/sdd/compositeleadingindicatorsclifrequentlyaskedquestionsfaqs.htm
[4] https://www.oecd.org/sdd/leading-indicators/composite-leading-indicators-cli-oecd-november-2021.htm
Retrouvez l’ensemble de nos articles Business


